Equity and Capital Markets
Summary: You can grow money in different ways
Investment Fundamentals
- Investment is less now for more later
- Real Assets can do things, financial assets are claims on real assets
- Debt: Money Markets (Certificates of deposit, T-bills, commercial paper), bonds, preferred stock (mixed)
- Treasury Notes/Bonds: U.S. gov
- Municipal Bonds: Issued by state/local gov’t, tax-free interest.
- Corporate Bonds: Issued by companies, taxed, more risk.
- Others: Mortgage-backed, international, agency bonds.
- Equity: Claim to a part of a company
- Common Stock: Ownership, voting rights, dividends, highest risk.
- Preferred Stock: Fixed dividends, no voting rights, lower risk.
- ADRs: U.S.-traded shares of foreign companies.
- Derivative: Based off value of something else
- Options: Right to buy/sell (Call = buy, Put = sell)
- Futures: Obligation to buy/sell later
- Futures vs. Forwards: Futures = traded, standardized; Forwards = private, customizable
- Debt: Money Markets (Certificates of deposit, T-bills, commercial paper), bonds, preferred stock (mixed)
- Big companies separate ownership (shareholders) from management (executives), ensure leaders act in shareholder interests.
- Ethical failures like accounting scandals (Enron, WorldCom) cost companies billions.
- Corporate Governance and Ethics: Trust is super important.
- Poor governance adds to costs and hurts public confidence, Sarbanes-Oxley Act made after scandals to enforce stricter rules.
- Investment Process: Asset Allocation (What category I buy?) -> Security Selection (What exactly will I buy?) -> Risk vs Return (What category am I willing to lose?)
- Efficient Markets: In an efficient market, prices reflect all available information.
- Active management tries to beat the market, passive management copies
- Financial Players:
- Business Firms: Borrow money to grow.
- Households: Save and invest.
- Governments: Borrow or save.
- Financial Intermediaries: Help connect borrowers and lenders (banks, investment firms, etc.).
- 2008 Financial Crisis: Banks gave out too much in loans and people losing jobs made everything a lot worse.
- Equity Return: Return = Dividend Yield + Capital Gain (How much it went up)
- Market Indexes track market performance.
- Weighting Types:
- Price-weighted (based of price of share, ex. DJIA)
- Value-weighted (based off value of company, ex. S&P 500)
- Equal-weighted (everything is same percentage)
Securities Markets and Trading
- Primary Market: Company sells new shares and gets the money.
- Secondary Market: Investors trade shares; company doesn’t get any money.
- Private (Up to 499 shareholders, fewer public disclosures.) vs. Public (Shares sold to the public, must register with the SEC, per Securities Act of 1933)
- IPO (Initial Public Offering): First time a company sells shares to the public.
- SEO (Seasoned Equity Offering): A public company selling more shares later on.
- Underwriting
- Investment banks buy shares from the company, sell to public.
- They help with legal filings, pricing, and marketing (roadshows).
- Bookbuilding: Gauge demand from big investors to set price.
- Shelf Registration: Pre-approval to sell shares anytime within 2 years (SEC Rule 415).
- Trading Securities: Goal is easy and cheap buying/selling of assets.
- Direct Search: Find buyers/sellers yourself.
- Brokered: Use agent to find match.
- Dealer: Buy/sell from middleman.
- Auction: Everyone meets in one place (e.g., NYSE).
- Orders: Market: Fill me now! Limit: Fill me if it’s good enough. Stop: Fill me if it’s against me too much
- U.S. Exchange Markets
- NYSE: Big companies, auction-based.
- AMEX: Mid-size firms, ETFs.
- NASDAQ: Tech-heavy, dealer-based.
- OTC: Smaller, less regulated, lower volume.
- Trading Costs
- Commission: Fee to broker.
- Spread: Difference between bid and ask price.
- Brokers: Full-Service (Advice + trading like Merrill Lynch) or Discount (Just trading like Schwab, E*Trade)
- Buying on Margin: Buying with Borrowed Money.
- Initial Margin Requirement (IMR): You must fund at least 50%.
- Maintenance Margin: If your equity falls too low (e.g., 25–40%), you get a margin call.
- Formula for Call: Price ≤ Borrowed / (1 − Maintenance Margin)
- Short Selling: Betting stock falls by borrowing and sell shares, then buying back later.
- Need to put up margin, margin call if not enough money
- Call Price Formula: Price ≥ Total Margin / (1 − Maintenance Margin)
Mutual Funds, Hedge Funds and Others
- Investment Companies: Manage money from investors. Offer diversification, professional management, and lower costs.
- NAV (Net Asset Value) = Total assets minus liabilities, per share.
- Types of Investment Companies
- Unit Investment Trusts: Fixed portfolio, no active trading.
- Open-End Funds (Mutual Funds): Shares are bought/sold at NAV.
- Operating Expenses: Admin and management.
- Front-End Load: Fee when you buy
- Back-End Load: Fee when you sell
- 12b-1 Fees: Marketing
- Closed-End Funds: Shares traded like stocks; price may be above or below NAV.
- Sold via IPO, then traded like stocks.
- Often sell below NAV (at a discount, due to illiquidity premium).
- Dividends paid to investors.
- Others:
- Commingled Funds: For large investors like pension funds.
- REITs: Invest in real estate.
- Hedge Funds: High-risk, for the wealthy, few rules.
- Exchange-Traded Funds (ETFs)
- Traded all day like stocks.
- Usually track indexes (passively managed).
- Lower costs, tax efficient, small NAV deviations.
- Hedge Funds: Only for wealthy individuals/institutions.
- Less Transparent and less Liquid: Lock-up periods (1–3 years).
- Fee Structure: 1–2% management fee + 20% of profits over high water mark (benchmark)
- Strategies:
- Long/Short Equity
- Market Neutral
- Arbitrage (Merger, Convertible, Fixed-Income)
- Event-Driven
- Global Macro (World situation)
- Statistical/High-Frequency Trading
- Fund of Hedge Funds: Invest in multiple hedge funds, but with extra fees.
- Higher risk, higher potential returns (but less regulated).
- Behavioral Factors: Emotional stress (e.g., divorce) can hurt manager performance.
- Metrics Used:
- Mean: Average return (geometric mean is multiple all to the power of 1/n)
- Variance/Standard Deviation: Risk (how much returns vary).
- Covariance/Correlation: How assets move together.
Risk and Return
- Holding-Period Return (HPR): (P1 + D1)/P0 – 1
- Income Yield (D1): Dividend divided by initial price.
- Capital Gain: Price increase divided by initial price.
- Expected = forecasted, Realized = actual. They often differ.
- If Compounding Returns: (1 + r1)(1 + r2)…(1 + rn) – 1
- Averages:
- Arithmetic: Simple average
- Geometric: Compounded average
- Dollar-weighted: Adjusted for money invested over time
- Risk and Sharpe Ratio: Risk = Uncertainty, Measured by standard deviation (volatility)
- Other Risk Measures:
- Skew: Tilt of distribution
- Kurtosis: Likelihood of extreme outcomes
- Sharpe Ratio (high is good) = (Return – Risk-Free Rate) / Std. Dev
- Risk Aversion: Investors prefer certainty.
- To take on risk, they demand a higher return (risk premium).
- Capital Allocation Line (CAL) & Capital Market Line (CML)
- CAL: Combines a risk-free asset with a risky portfolio.
The slope = Sharpe Ratio.- Optimal Portfolio: Tangent point from the risk-free rate to the efficient frontier.
- This point gives the best Sharpe Ratio (optimal risky portfolio).
- CML: CAL using the market portfolio as the risky asset.
- You can leverage to get more return (borrow at risk-free rate to invest more in risky assets).
- CAL: Combines a risk-free asset with a risky portfolio.
- Diversification: Spreading money across multiple assets reduces risk.
- Goal: Combine assets with low or negative correlation to reduce overall risk.
- Types of risk: Systematic (market) and Unsystematic (firm-specific)
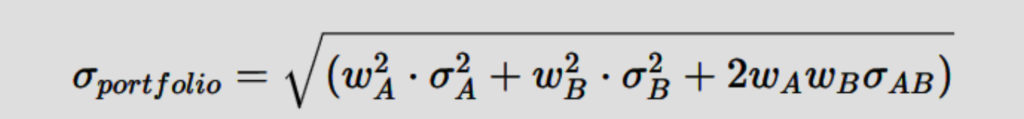
- Two Risky Assets
- Portfolio Return = Weighted average of individual returns
- Portfolio Risk = Depends on Individual risks and Correlation
- Correlation between assets
- If correlation = -1: Perfect diversification.
- If correlation = 1: No diversification benefit.
- Correlation between assets
- Efficient Frontier is the set of best portfolios (highest return for each level of risk).
- Dominated portfolios: Lower return for more risk → avoid them.
- Efficient portfolios lie above the “minimum variance” portfolio.
- Combine it with risk-free asset to suit risk tolerance.
- Portfolio Applications
- Target a specific risk level
- Find the minimum variance portfolio
- Build the complete portfolio (risky + risk-free mix)
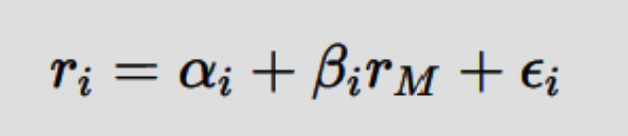
- Single-Index Model: How stock returns relate to the market:
- Alpha: Extra return not explained by the market
- Beta: Sensitivity to market movements
- Epsilon: Firm-specific noise
Capital Asset Pricing Model
- Capital Asset Pricing Model (CAPM) predicts how much return a stock should give based on: Risk-free rate, Market return and beta (β) risk vs. the market
- Formula: Expected Return = Risk-Free Rate + Beta x (Market Return – Risk-Free Rate)
- Key Assumptions of CAPM
- Everyone agrees on expected returns and risks
- No trading costs, taxes, or restrictions
- Investors can borrow/lend as much as they want at the risk free rate
- Everyone owns the same market portfolio (all assets weighted by value)
- Beta measures a stock’s sensitivity to market moves. Market’s beta = 1
- If > 1 then stock is more volatile than the market
- Portfolio beta = weighted average of individual betas
- SML vs. CML
- SML (Security Market Line): plots return vs. beta, works for any asset
- CML (Capital Market Line): plots return vs. standard deviation (volatility), only applies to efficient portfolios
- Alpha = actual return – CAPM predicted return
- Positive alpha: stock outperformed CAPM → could be underpriced
- Negative alpha: stock underperformed → could be overpriced
- Underpriced (return > CAPM return) vs. Overpriced (return < CAPM return)
- Diversification: Holding many stocks reduces firm-specific (unsystematic) risk
- 20–30 stocks eliminates most of this risk
- Market risk (systematic) cannot be diversified away
- Application Examples
- Use different betas and returns to find if stocks are fairly priced
- Solve for market risk premium or risk-free rate if given two portfolios
- Perception vs. Reality: If you think a bad company is not as bad as others think it can be a good buy, market prices reflect average belief (George Soros strategy)
Behavioral finance and investment strategies
- Efficient Market Hypothesis (EMH): Prices reflect all available info.
- Prices move randomly and there’s no predictable patterns.
- You can’t get high returns without taking more risk.
- Markets become more efficient when investors compete and react fast to info. Arbitrage corrects mispricing.
- Types of Market Efficiency
- Weak Form: Prices reflect all past price data. Technical analysis won’t help.
- Semi-Strong Form: Prices reflect all public info. Fundamental analysis won’t help.
- Strong Form: Prices reflect all info, even insider info. No one has an edge.
- Technical Analysis
- Uses price charts, trends, and volume to predict movements.
- Believes prices adjust slowly to new info.
- Fundamental Analysis
- Looks at earnings, dividends, and company data.
- Active managers rarely beat the market.
- Market Anomalies (Strategies that seem to beat the market):
- Small-Firm Effect: Small stocks outperform.
- Neglected Firm: Unpopular stocks do well.
- Value Investing: Low P/E or book-to-market stocks do better.
- Momentum: Winners keep winning.
- Post-Earnings Drift: Prices slowly react to earnings news.
- Interpreting Anomalies: Could be due to bad risk measures, trading costs, data mining, risk premiums or inefficiencies.
- Behavioral Finance: Psychology to investing behavior.
- Investors make mistakes and act irrationally, so prices may not reflect true value.
- Key Theories
- Prospect Theory: People fear losses more than they value gains.
- Loss Aversion: Losses hurt more than equivalent gains feel good.
- Mental Accounting: We treat money differently depending on where it comes from.
- Information Processing Errors
- Forecasting Errors: Rely too much on recent events.
- Overconfidence: Think we’re better than we are (especially men).
- Conservatism: Too slow to react to new info.
- Sample-Size Neglect: See patterns in too little data.
- Biased Self-Attribution: Take credit for wins, blame bad luck for losses.
- Behavioral Biases
- Disposition Effect: Hold losers, sell winners.
- Framing: Decisions change based on how info is presented.
- Regret Avoidance: Avoid choices that might cause future regret.
- Ambiguity Aversion: Avoid unfamiliar investments (e.g., foreign stocks).
- Technical Analysis & Behavioral Finance
- Moving Averages & Trends: Used to find direction.
- Sentiment Indicators: Gauge mood of the market (short interest, put/call ratio).
- People often see patterns that don’t exist (me drawing fictional supports when I’m down)
Equity Valuation
- Equity Valuation: Comparing what a stock is really worth to what it’s selling for on the market.
- Valuation Methods
- Dividend Discount Model (DDM): Values a stock by estimating all future dividends and discounting them back to the present.
- Use if consistent dividends and expected steady growth
- Gordon Growth Model: A version of DDM that assumes dividends grow at a constant rate.
- Use if dividends grow at a constant rate forever and steady growth
- FCFF (Free Cash Flow to Firm): Cash left for all investors (debt + equity).
- Use if no dividend, want to value debt + equity
- FCFE (Free Cash Flow to Equity): Cash left only for shareholders.
- Use if no dividend, want to find shareholder value
- P/E Ratios (Price/Earnings): Higher = more growth expected.
- Use if comparing or want quick valuation
- Other Ratios: Price/Book, Price/Cash-Flow, Price/Sales.
- Use if negative earnings, worried about accounting tricks
- Dividend Discount Model (DDM): Values a stock by estimating all future dividends and discounting them back to the present.
- Intrinsic Value: What the stock is truly worth (based on fundamentals).
- Use discount rate (k) to bring future cash flows to today’s value.
- Growth Concepts
- g (growth rate) = ROE × b
- ROE: Return on Equity
- b: Retention ratio (earnings kept in business)
- More reinvestment = more growth
- Multistage Models are for companies that grow fast first, then slow down.
- Two-stage model: High growth for a few years then stable growth.
- Price/Earnings (P/E) Ratio: P/E = Price / Earnings
- Adjusted by growth: PEG Ratio = P/E / Growth rate
- No growth? P/E = 1 / k
- Risk: P/E ratios go down when
- Interest rates go up
- Inflation rises
- Company is risky
- Earnings can be manipulate, look at cash flows too.
Options
- A call option gives the right to buy a stock at a set price before a certain date.
- Go up when stock price goes up.
- Go down when strike price goes up.
- More valuable with higher volatility.
- A put option gives the right to sell a stock at a set price before a certain date.
- Go down when stock price goes up.
- Go up when strike price goes up.
- Also more valuable with higher volatility.
- Buying an option gives rights, not obligations.
- Selling (writing) an option gives obligations, not rights.
- Strike Price: The price you can buy or sell the stock for.
- Premium: What you pay to buy the option.
- In the Money: Exercising the option makes money.
- Out of the Money: Exercising the option loses money.
- At the Money: Stock price = strike price.
- Options can be traded on exchanges (standardized) or OTC (customized).
- American options can be used anytime before they expire.
- European options can only be used at expiration.
- Bermuda: Can be exercised at specific times
- Zero-Sum Game: One traders gain = another’s loss.
- Binomial Option Pricing assumes stock goes up or down by certain amounts. Use math to match option payoff.
- Black-Scholes Model is a complex formula for European options based on constant interest rates and stock volatility.
- Put-Call Parity links the price of calls and puts. Works only for European options without dividends.
- Basic Strategies
- Protective Put: Buy stock + buy put to limit losses.
- Covered Call: Buy stock + sell call to earn income.
- Straddle: Buy call + put to profit from big moves either way.
- Spread: Buy at favorable strike price sell option at less favorable strike
- Collar: Buy stock + buy put + sell call to limit both gains and losses.
- Advanced Strategies
- Short Straddle: Sell both a call and a put, bet on low movement.
- Long Call Butterfly: Buy one call option at a low strike price, sell two call options at a middle strike price, and buy one call option at a high strike price.
- Long Put Butterfly: Buy one put option at a high strike price, sell two put options at a middle strike price, and buy one put option at a low strike price.
- Option-Like Securities
- Callable Bonds: Company can buy back bonds early.
- Convertible Bonds: Can be swapped for stock.
- Warrants: Company-issued call options.
- Collateralized Loans: Borrower can choose to repay or walk away based on value of the collateral.
Fintech
- FinTech is tech applied to financial services to make them faster, cheaper, and more accessible.
- How it helps: Cuts costs, widens access, drives innovation, appeals to younger, digital users
- Key Areas of FinTech
- Payments: Mobile wallets, real-time transfers, buy now pay later
- WealthTech: Robo-advisors, trading apps, algorithms
- Lending: Online loans, P2P platforms, credit scored by AI
- InsurTech: Smarter, personalized insurance using data
- Big Data and AI: Powers credit scoring, fraud detection, personalization
- Blockchain & Digital Currency: Decentralized finance, smart contracts, crypto
- Open Banking: Apps use your banking data to offer better services
- RegTech: Automates compliance, lowers regulatory costs
- Risks: Cybersecurity threats, regulatory uncertainty, bias in algorithms, inexperience in financial fundamentals