Debt and Money Markets
Summary: We can income off buying Government and Corporate Debt, which have specifications. No free lunch, only way to win is to predict the interest rate.
Introduction to Fixed Income Securities
| Debt vs Equity | Debt | Equity |
|---|---|---|
| Payment Amount | Fixed | Variable |
| Payment | Fixed | Variable |
| Seniority | First | Last |
| Duration | Fixed | Perpetual |
| Liquidity | Low | High |
| Variety | Infinite | One |
- Geometric Mean: Multiple all numbers, then do that to the power of 1/n (nth square root)
- Bond Valuation: Add all of [Coupon/(1 + YTM)^year], Coupon + Par for last payment
- Rate theories: What determines interest rates?
- Market Segmentation: Each time interval determined separately
- Liquidity Premium: The longer the term the higher the rate
- Expectation: Price based off what people think future will be
- Determinants of Value:
- Expected Cash Flow: Positive correlation
- Timing of Cash Flow: Sooner is better
- Discount Rate: Inverse correlation (as it is in the denominator)
- If coupon > yield, premium, if coupon < yield, discount, if equal price is par
- Convergence: Over time the price approaches par
- Convexity: Greater percent change when discount rates decrease
- Coupon: Less coupon bonds more sensitive to price
- Chronological: Longer term more sensitive to price
Interest Rates
- Risk Free Rate: US Treasuries
- Federal Reserve Policy
- Supply and Demand
- Exogenous (external factors)
- Spread determinants: Credit risk (will it default), liquidity risk (can I sell), time to maturity
- Credit risk based off seniority and recovery rate (assets backing), rating agencies inflate, lag
- 4 C’s: Capacity (can they repay), Collateral (assets), Covenants (rules agreed to), Character (management)
- Capacity determined by ratios: Pros: simple, trends, audited statements. Cons: No benchmark, snapshot, past not future
- Liquidity: Short term cash.
- Current Ratio: (current assets/current liabilities)
- Quick ratio ((current assets-inventory)/current liabilities)
- Net Working Capital: (current assets – current liabilities)
- Working capital: How well is firm managing inventory and trade
- Average collection or Days Receivable: (Accounts Receivables / Sales) * 365
- Payables Period or Days Payable: (Accounts Payable / Cost of Goods Sold) * 365
- Inventory Holding or Conversion: (Inventory / Cost of Goods Sold) * 365
- Cash Conversion Cycle = Days Receivable + Inventory Holding – Payables Period
- Profitability: How much money are you making: Gross profit = revenue – cost of goods sold (COGS). Net income is the amount of money a company makes after subtracting all expenses and taxes from revenue.
- EBITDA: Earnings before interest, taxes, depreciation and amortization, Free Cash Flow
- Margins: Gross Profit = Profit/Sales, Net Profit = Income/Sales, Operating = EBIT/Sales
- Return on Equity = Net Income / Equity
- Return on Assets = Net Income / Assets
- Capital Structure: Debt Ratio = Total Liabilities / Total Assets
- Coverage Ratios
- Interest Coverage = EBIT/ Interest Expenses, MIGHT use EBITDA, DA is depreciation/amortization
- Efficiency Ratios:
- Total Asset Turnover = Sales/Assets
- Fixed Asset Turnover = Sales / Fixed Assets (assets that are hard to convert to cash, like a building)
- DuPont: ROE = Net Income / Equity = (Net Income/Sales) * (Sales/Assets) * (Assets/Equity)
- Rate theories: What determines interest rates?
- Market Segmentation: Each time interval determined separately
- Liquidity Premium: The longer the term the higher the rate
- Expectation: Price based off what people think future will be
- Calculating Spot/Forward: All the rates multiplied should be same on both sides (no arbitrage principle)
Bond Pricing
- Input dates on Calculator with MM.DDYYYY format, to find change, type in first date, delta date button, second date, delta date
- When in between coupons:
- NOTE: t = time passed from payment, so accrued time, T = payment period (subtract dates if act/act)
- Find PV with N, I (account for period), PMT (account for period), FV=Par
- Full Price: Find FV with N = t/T, PV=what we got above, I (account for period, same as above)
- Accrued Interest: Coupon * t/T
- Flat Price (Clean Price, what we use to compare) = Full Price – Accrued Interest
- If YTM is given replace I with YTM/(P/Y)
- Inverse: Yield and price are inverse, as yield represents opportunity cost, so you need to be compensated for it with price
- Convexity: Decrease in rate cause greater percent increase in price, because lowering rate represents bigger delta % in rate
Callable Bonds
- Callable bonds can be redeemed by the issuer at a specific time and price. This makes them cheaper, since there’s a chance they get called, which would be disadvantageous for the buyer.
- To price:
Convexity
- Convexity is a measure of the curvature in the price-yield relationship of a bond. It explains how duration of a bond changes as interest rates change.
- Positive convexity: Bond prices rise faster when rates fall and drop slower when rates rise. Most vanilla bonds have this.
- Negative convexity: The reverse—price gains are limited when rates fall. Callable bonds often exhibit this.
- Callable bonds underperform when rates fall (due to call risk).
- We can use calculus to estimate.
Bonds with Embedded Options
- Options: Derivatives that give option to buy or sell, zero sum (someone’s win is another’s loss)
- American (continuous), European (expiration only), Bermuda (Set times)
- Callable: Issuer can buy back at specified time and price, they only will if it benefits them, always cheaper/same
- Call option more valuable at lower yields, call puts limit on bond value increases
- Remember option free bonds have positive convexity (yield decreases have bigger impact)
- Call option more valuable at lower yields, call puts limit on bond value increases
- Putable bonds: lets buyers sell, makes the bond more expensive
- If a bond is not callable don’t use the tree, use spot rates
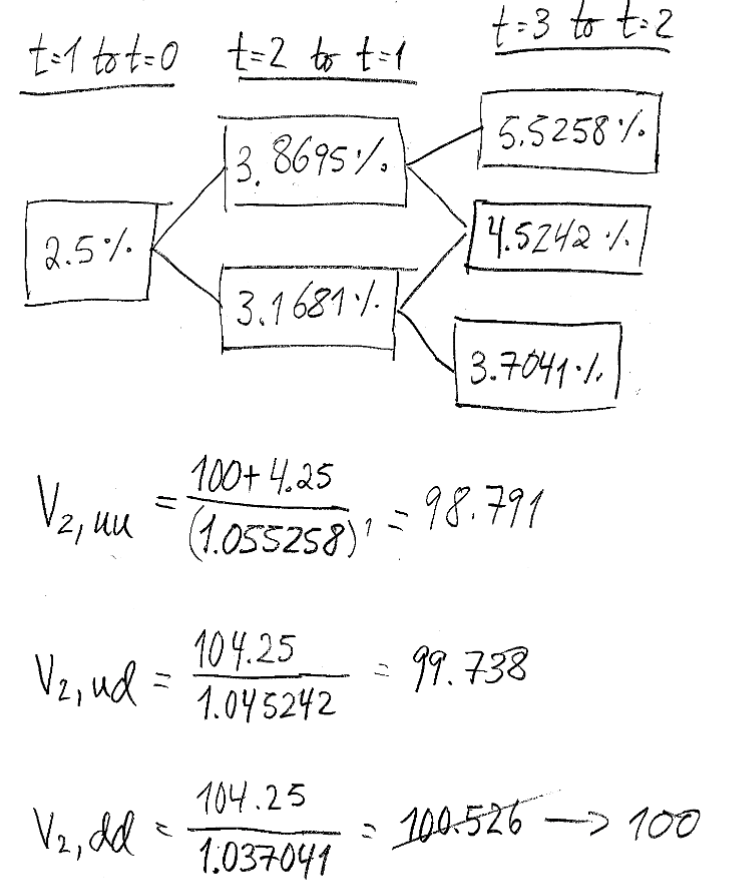
- Binomial Tree: Up and down scenarios
- Do steps in the picture to find year two prices, then discount back to year one with same process sum all (probability * price) then add coupon.
Mortgage Backed Securities
- MBS: Bundles of mortgages, securitized (able to be split) + sold to investors
- Process: Banks make loans -> Separate entity -> Entity issues -> Entity underwrites (accepts liability)
- Pros: Direct investment in mortgages, more mortgages active, cheaper rates, liquidity, bank profit
- Cons: More mortgages = more risk, hard to observe risk (since bundled)
- Amortization: Gradual reduction of principal over time
- Weighted Average Coupon = Sum of [(Individual Mortgage/Total Mortgage) * Rate of individual mortgage]
- Weighted Average Maturity= Sum of [(Individual Mortgage/Total Mortgage) * Duration of individual mortgage]
- Pass through: What the investor actually gets after bank fees
- Single Monthly mortality rate: Public security association benchmark of 0.2% defaults per month, increasing by 0.2% until month 30.
- Risks: Contraction (prepayments on low rates), Extension (less prepayments on high rates)
- Tranches: Tiers, there’s sequential (senior paid first) and credit or default (junior takes default losses first)
- Prepayment: Adds to tranche cash flow
- Defaults: Does NOT add to tranche cash flow, this is lost money
Total MBS
| Year | Beginning Balance | Payment | Interest | Principal | End Balance |
| First one given, after that use end balance of previous column | N = Total Years I = WAC PV = BB Find PMT | BB*WAC | PMT – I | BB – Principal |
Time Tranche (Junior doesn’t get paid until senior completely paid off, default risk is porportional)
| Year | Beginning Balance | Interest | Principal | End Balance | Cash Flow |
| First one given, after that use end balance of previous column, it’s the proportion of tranche | BB*Pass through | PMT – I | BB – Principal | Principal + Interest |
Credit Tranche (Junior tranche wiped out first, the secret to doing these is to rebalance the allocation of payment following tranches disproportionally taking a default loss)
| Year | Beginning Balance | Interest | Principal | End Balance | Cash Flow |
| First one given, after that use end balance of previous column, it’s the proportion of tranche | BB*Pass through | PMT – I | BB – Principal | Principal + Interest |