Supply Chain
Summary: It takes a lot of effort to get products
Exam 1
Operations and Productivity
- Production: Creating goods and services
- Operations management: Creating value, input to outputs
- 3 Functions: Marketing, Productions/Operations, Finance/Accounting
- Supply Chain: Network of organizations that supplies goods/services
- The goal is customer satisfaction, efficiency, competitive advantage
- Why Study OM?
- 1. OM is one of three major functions, how is production organized?
- 2. How are good and services produced
- 3. What do operation managers do
- 4. OM is such a costly part of an organization
- Goods are usually tangible, services are not
- Productivity: Output/Input, single factor has one input, multi has multiple inputs
- Measurement Problems: Quality, external elements, units might be lacking
- Variables of Productivity: Labor (10% of increase), capital (38%), management (52%)
- Service typically labor intensive, customized, intellectual, hard to automate/evaluate for quality
- Challenges: Globalization, partnering, sustainability, rapid development, customization, being lean
- Also making high quality, safe products, retaining/training talent, and honoring commitments.
Operations Strategy in a Global Environment
- Globalization: Companies are becoming worldwide, world trade increasing
- 1. Improve the supply chain: locating facility closer to resource (ex: steel plant in Ruhr)
2. Reduce costs and exchange rate risks: trade agreements lower tariffs
3. Improve operations: comparative advantage in production
4. Understand markets: New opportunities
5. Improve products: Collaboration, comparative advantage
6. Attract and retain global talent
- 1. Improve the supply chain: locating facility closer to resource (ex: steel plant in Ruhr)
- Cultures and laws and norms differ which may be an issue, mobility of info, goods, people.
- Mission: What we want to do. Strategy: How
- Strategies for Competitive Advantage
- Differentiation – better, or at least different
- Cost leadership – cheaper
- Response – more responsive (flexibility in market changes, adapting)
- Product Life Cycle: Introduction (R&D, get market share), Growth (increase capacity), Maturity, Decline
- SWOT: Strengths, weaknesses, opportunities, threats
- Strategy Development and Implementation: Identify success factors -> Integrate OM -> Build and staff
- Outsourcing: Have external suppliers, increasing due to cost, speed, and reliability
- Subcontracting: Hire someone to do part of the work for a task
- Insufficient analysis most common reason for failure, factor analysis rates by criteria, give weights
- Global Operations Strategy Options
- International: Import/export or license, low response/cost reduction
- Globalization: Standardization, cross cultural, saves costs but hard to respond locally
- Multidomestic: Existing model globally (franchise, join venture, subsidiary), high response, costly
- Transnational: Move material/people across boundaries, high cost saving/responsiveness
Forecasting
- Good Forecasting gives a Competitive Advantage
- Forecasting: Predicts future events, helps decide production, inventory, personnel, facilities.
- Time frames: Short (< 1 year, usually less than a month), Medium (3 months to 3 years), long (3+ years)
- Shorter term more accurate, longer term more comprehensive issues
- If marginal cost above average, average increases, relative place is direction
- Types of Forecasts: Economic (inflation, money supply, etc), Technological (how fast), Demand
- Uses: Supply Chain, Human Resources, Capacity
- Steps:
- 1. Determine the use of the forecast
2. Select the items to be forecasted
3. Determine time horizon
4. Select the forecasting model(s)
5. Gather data needed to make the forecast
6. Make the forecast
7. Validate and implement the results
- 1. Determine the use of the forecast
- Issues: Forecasts are inaccurate, they assume stability, product family forecasts more accurate
- Qualitative: Used when situation is vague, little data (like new product), involves intutition and experience
- Jury (pool of experts), Delphi (experts separately), Sales force (ask sales), Market (ask consumer)
- Quantitative: Used when data is stable and a lot, involves math
- Naive (past is future), Moving average, exponential smoothing, trends, linear regression
- Least squares: Super complicated he gives the formula
- Exponential smoothing: Forecast = Last Forecast + alpha(last demand – last forecast)
- Mean Absolute Deviation (error measure): sum of all differences divided by number of terms
- Mean squared error: square each error, add it, divide by number of terms
- Mean Absolute Percent Error: Find percent of error, add it all up, divide by number of terms
- Components: seasonal (pattern in year), cyclical, random
Inventory Management
- Goal: Balance between inventory investment and customer service
- Inventory: one of the most expensive assets, less means lower cost but might run out
- Helps provide selection, separate production, get bulk discounts, hedge against inflation
- Types: Raw (can’t use), Work in Progress, Maintenance/Repair (needed to operate), Finished good
- ABC Analysis: A (top 20% of items), B (next 30%), C is bottom half
- Record Keeping: Different prices for different people, bad for consumer
Exam 2
Project Management Fundamentals
- 🔹 Functions of a Project Manager
- Planning, scheduling, controlling resources, meeting quality/time/cost targets.
- 🔹 Importance of Project Management
- Coordinates complex projects (e.g., Bechtel’s data center builds).
- Keeps large-scale efforts on time, within budget.
- 🔹 Project Planning
- Steps: Define → Set Goals → Work Breakdown Structure → Allocate Resources → Team Structure
- Example: Building construction tasks like framing, pouring, wiring.
- 🔹 Project Scheduling
- Tools: Gantt Charts, CPM, PERT
- Defines start/end times and task order.
- 🔹 Project Controlling
- Tools: MS Project, Oracle Primavera.
- Adjusts plans using performance feedback.
- 🔹 PERT vs. CPM
- PERT = probabilistic time estimates (uncertain tasks).
- CPM = deterministic time + cost trade-offs (crashing projects).
- 🔹 Determining Project Schedule
- Critical Path = Longest activity path (no slack).
- Delay in any critical task delays entire project.
- 🔹 Project Crashing
- Calculate crash cost per unit time.
- Identify critical path activities.
- Shorten lowest-cost critical activity first.
- Formulas
- Earliest Start (ES) / Earliest Finish (EF): Forward pass
- Latest Start (LS) / Latest Finish (LF): Backward pass
- Slack Time: LS − ES = LF − EF
Operations & Process Strategy
🔹 Process Strategies
- Process Focus: High flexibility, low efficiency (e.g., hospital).
- Repetitive Focus: Assembly lines (e.g., Harley-Davidson).
- Product Focus: High volume, low variety (e.g., Frito-Lay).
- Mass Customization: Efficiency + Flexibility (e.g., Dell).
🔹 Selection of Equipment
- Consider cost, flexibility, capacity, quality, and market volatility.
🔹 Process Analysis & Design
- Tools: Flowcharts, Time-Function Mapping, Value-Stream Mapping
- Goal: Eliminate waste, maximize value.
🔹 Process Redesign
- Radical rethink of processes for big gains in cost/time/value.
🔹 Technology in Services
- Automation improves speed, quality, and convenience.
- Examples: ATMs, online education, robotic surgery.
Capacity, Bottlenecks & Cost Analysis
🔹 Capacity Planning
- Design Capacity: Ideal maximum output.
- Effective Capacity: Adjusted for expected realities.
- Actual Output: What’s actually produced.
🔹 Bottleneck Analysis & Theory of Constraints (TOC)
- Bottleneck = stage with lowest capacity (limits throughput).
- TOC Steps: Identify → Exploit → Subordinate → Elevate → Repeat
- Throughput Time: Time for one unit start to finish (no waiting).
🔹 Bottleneck Example
- Tasks A (12), B (8), C (14), D (10), E (10)
- C is bottleneck (14)
- If C gets 2 machines → 7 → A becomes bottleneck (12)
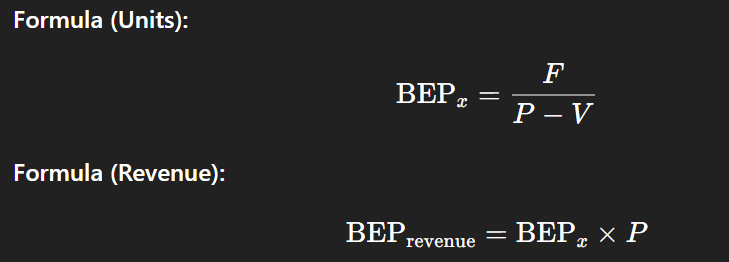
🔹 Break-Even Analysis
- Fixed Costs (F): Don’t change with volume
- Variable Costs (V): Per unit cost
- Selling Price (P)
🔹 Multiproduct Break-Even
- Weighted average contribution margins are used.
🔹 Incremental Changes to Reduce Risk
- Leading, Lagging, or Averaging capacity strategies to manage demand risk.
Exam 3
Quality Management
🔹 Strategic Importance
- Quality = Competitive Advantage: Drives productivity, cost reduction, and customer satisfaction.
- Example: Arnold Palmer Hospital uses TQM, benchmarking, and JIT to boost service quality.
🔹 Defining Quality
- Meeting customer expectations, consistently and efficiently.
🔹 Cost of Quality (4 Types)
- Prevention – Training, quality systems (before defect).
- Appraisal – Inspections, audits.
- Internal Failure – Scrap, rework (before delivery).
- External Failure – Warranty, returns (after delivery).
🔹 TQM Overview (Deming-Inspired)
- Culture of continuous improvement, organization-wide.
- Deming’s Points: Drive out fear, build quality into product, long-term supplier partnerships.
🔹 Seven TQM Concepts
- Continuous Improvement
- Six Sigma
- Employee Empowerment
- Benchmarking
- JIT
- Taguchi Concepts
- Use of Tools (see below)
🔹 TQM Tools
Idea Generation:
- Check Sheets: Data collection
- Scatter Diagrams: Correlation
- Cause-and-Effect Diagrams: Problem analysis
Data Organization:
- Pareto Charts: Prioritize major causes (80/20 Rule)
- Flowcharts: Visual process maps
Problem Identification:
- Histograms: Distribution analysis
- SPC Charts: Process monitoring
🔹 TQM in Services
- Employee Empowerment, Quality Circles, Benchmarking all apply to non-manufacturing settings.
Statistical Process Control (Spc)
🔹 Purpose
- Monitor and improve process stability over time using statistical charts.
🔹 Control Charts
- x̄-Chart: Monitors the mean.
- R-Chart: Monitors range/variability.
🔹 Control Limits
- UCL/LCL set ±3σ (standard deviations). 99.73% confidence range.
- A point outside control limits = assignable cause → investigate.
- Inside = natural variation → expected.
🔹 Variation Types
- Assignable: Specific, fixable cause (e.g., machine failure).
- Natural: Inherent, acceptable fluctuation.
🔹 Process Capability Metrics
- Cp = (USL − LSL) / 6σ
- Cp ≥ 1 → capable
- Cp = 1.33 → ideal
- Cp = 2 → Six Sigma level
- Cpk = min[(USL − μ)/3σ, (μ − LSL)/3σ]
- Shows if centered; Cpk > 1 = capable.
Lean Operations & Jit
🔹 Just-in-Time (JIT)
- Produces only what’s needed, when needed.
- TRUE: Can be used in services (e.g., call centers, fast food).
- Reduces inventory, exposes process flaws, improves flow.
🔹 Lean Philosophy
- Minimize waste, improve flow, focus on customer value.
- TPS (Toyota Production System): Origin of Lean; emphasizes:
- Waste reduction
- Employee involvement
- Continuous improvement
🔹 7 Wastes (TIMWOOD)
- Transportation – Unnecessary movement
- Inventory – Excess stock
- Motion – Inefficient actions
- Waiting – Idle time
- Overproduction – Making too much
- Overprocessing – Doing more than necessary
- Defects – Rework, scrap
👉 Know what isn’t a category—likely distractors include “energy,” “training,” “space.”
🔹 Lean in Services
- Applies by removing steps, cutting wait times, improving quality.
Exam 4
Strategic Supply Chain Decisions
- Coordinates sourcing, procurement, logistics, and production
- Impacts cost, quality, speed, flexibility, and customer satisfaction
- Builds competitive advantage through efficiency and responsiveness
🔹 Make or Buy Decision (Consider Total cost, quality risk, control loss)
- Make: Control, IP security, long-term cost savings
- Buy: Flexibility, speed, reduced capital, expertise access
🔹 Six Sourcing Strategies
- Many Suppliers – Commodity, price-driven
- Few Suppliers – Partnerships, reliability
- Vertical Integration – Full process control
- Joint Ventures – Shared risk/reward
- Keiretsu Networks – Cooperative relationships
- Virtual Companies – Flexible, asset-light partnerships
🔹 Supplier Selection Criteria: Cost, quality, capacity, reliability, location, ethics
Risk, Performance, & Evaluation
🔹 Supply Chain Risk
- Risks: Natural disasters, politics, bankruptcy, cyberattacks
- Mitigation Techniques: Multiple suppliers, Insurance, Backup production, Contractual risk sharing, Forecasting + data redundancy
🔹 Disaster Risk Evaluation
- Expected Risk Cost = Probability × Impact
- Risk Mapping + Diversification + Safety Stock
🔹 Bullwhip Effect: Demand shifts magnify
- Causes: Forecast error, batching, promotions, info gaps
- Solutions:
- Share real-time data
- Reduce lead time
- Eliminate volume discounts
- Smaller, frequent orders
🔹 Performance Metrics
- Inventory Turnover = COGS / Avg Inventory
- Weeks of Supply = (Avg Inventory / COGS) × 52
- Order Fill Rate = Orders Filled / Total Orders
- Others: Perfect Order Rate, Return Rate, Lead Time
🔹 Supplier Evaluation Tools
- Factor-Weighting Method: Assign weight → score → multiply → total
- Quantitative: TCO (Total Cost of Ownership)
- Qualitative: Certifications, performance, fit
- Hybrid: Best for strategic sourcing
Supply Chain Systems & Sustainability
- Seamless flow from raw materials to end user
- ERP: Enterprise-wide resource management
- VMI: Supplier manages buyer’s inventory
- CPFR: Collaborative Planning, Forecasting, Replenishment
🔹 Logistics & Distribution
- Logistics = Transportation, warehousing, handling
- Distribution Strategies:
- Cross-Docking: Move goods directly from inbound to outbound
- Drop-Shipping: Ship directly from supplier to customer
- Hub-and-Spoke: Central hub distributes to regional spokes
🔹 Ethics & Sustainability
- ESG Practices: Green sourcing, carbon tracking, closed-loop systems
- Ethical concerns: Labor conditions, corruption, sourcing transparency